Graphical Interface for naive and advanced users
The tool provides a drag-&-drop interface to model fault trees graphically, specify and verify measures of interest, plot results, and do step-by-step simulation of fault trees. Advanced users can use features like specifying custom properties, characterizing complex system behaviours (states using boolean equations) and quantifying their probabilities.
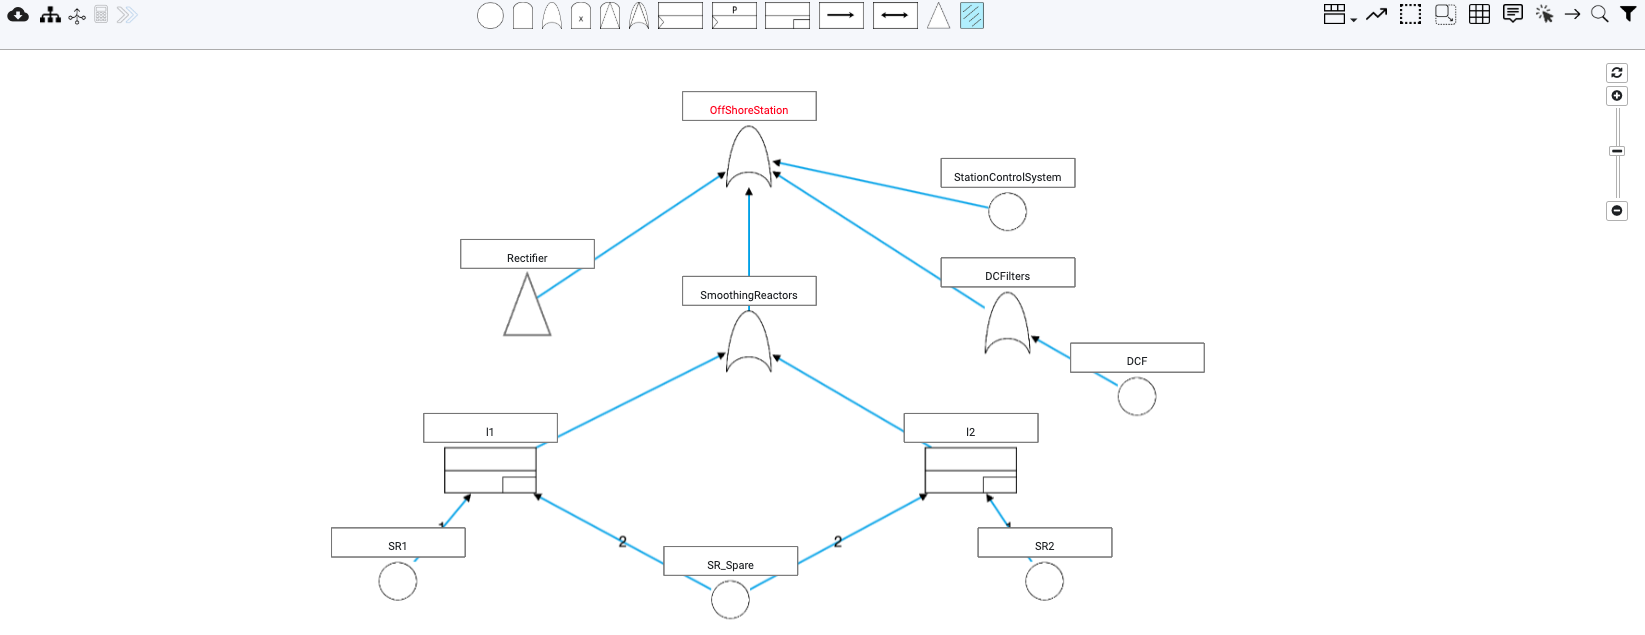
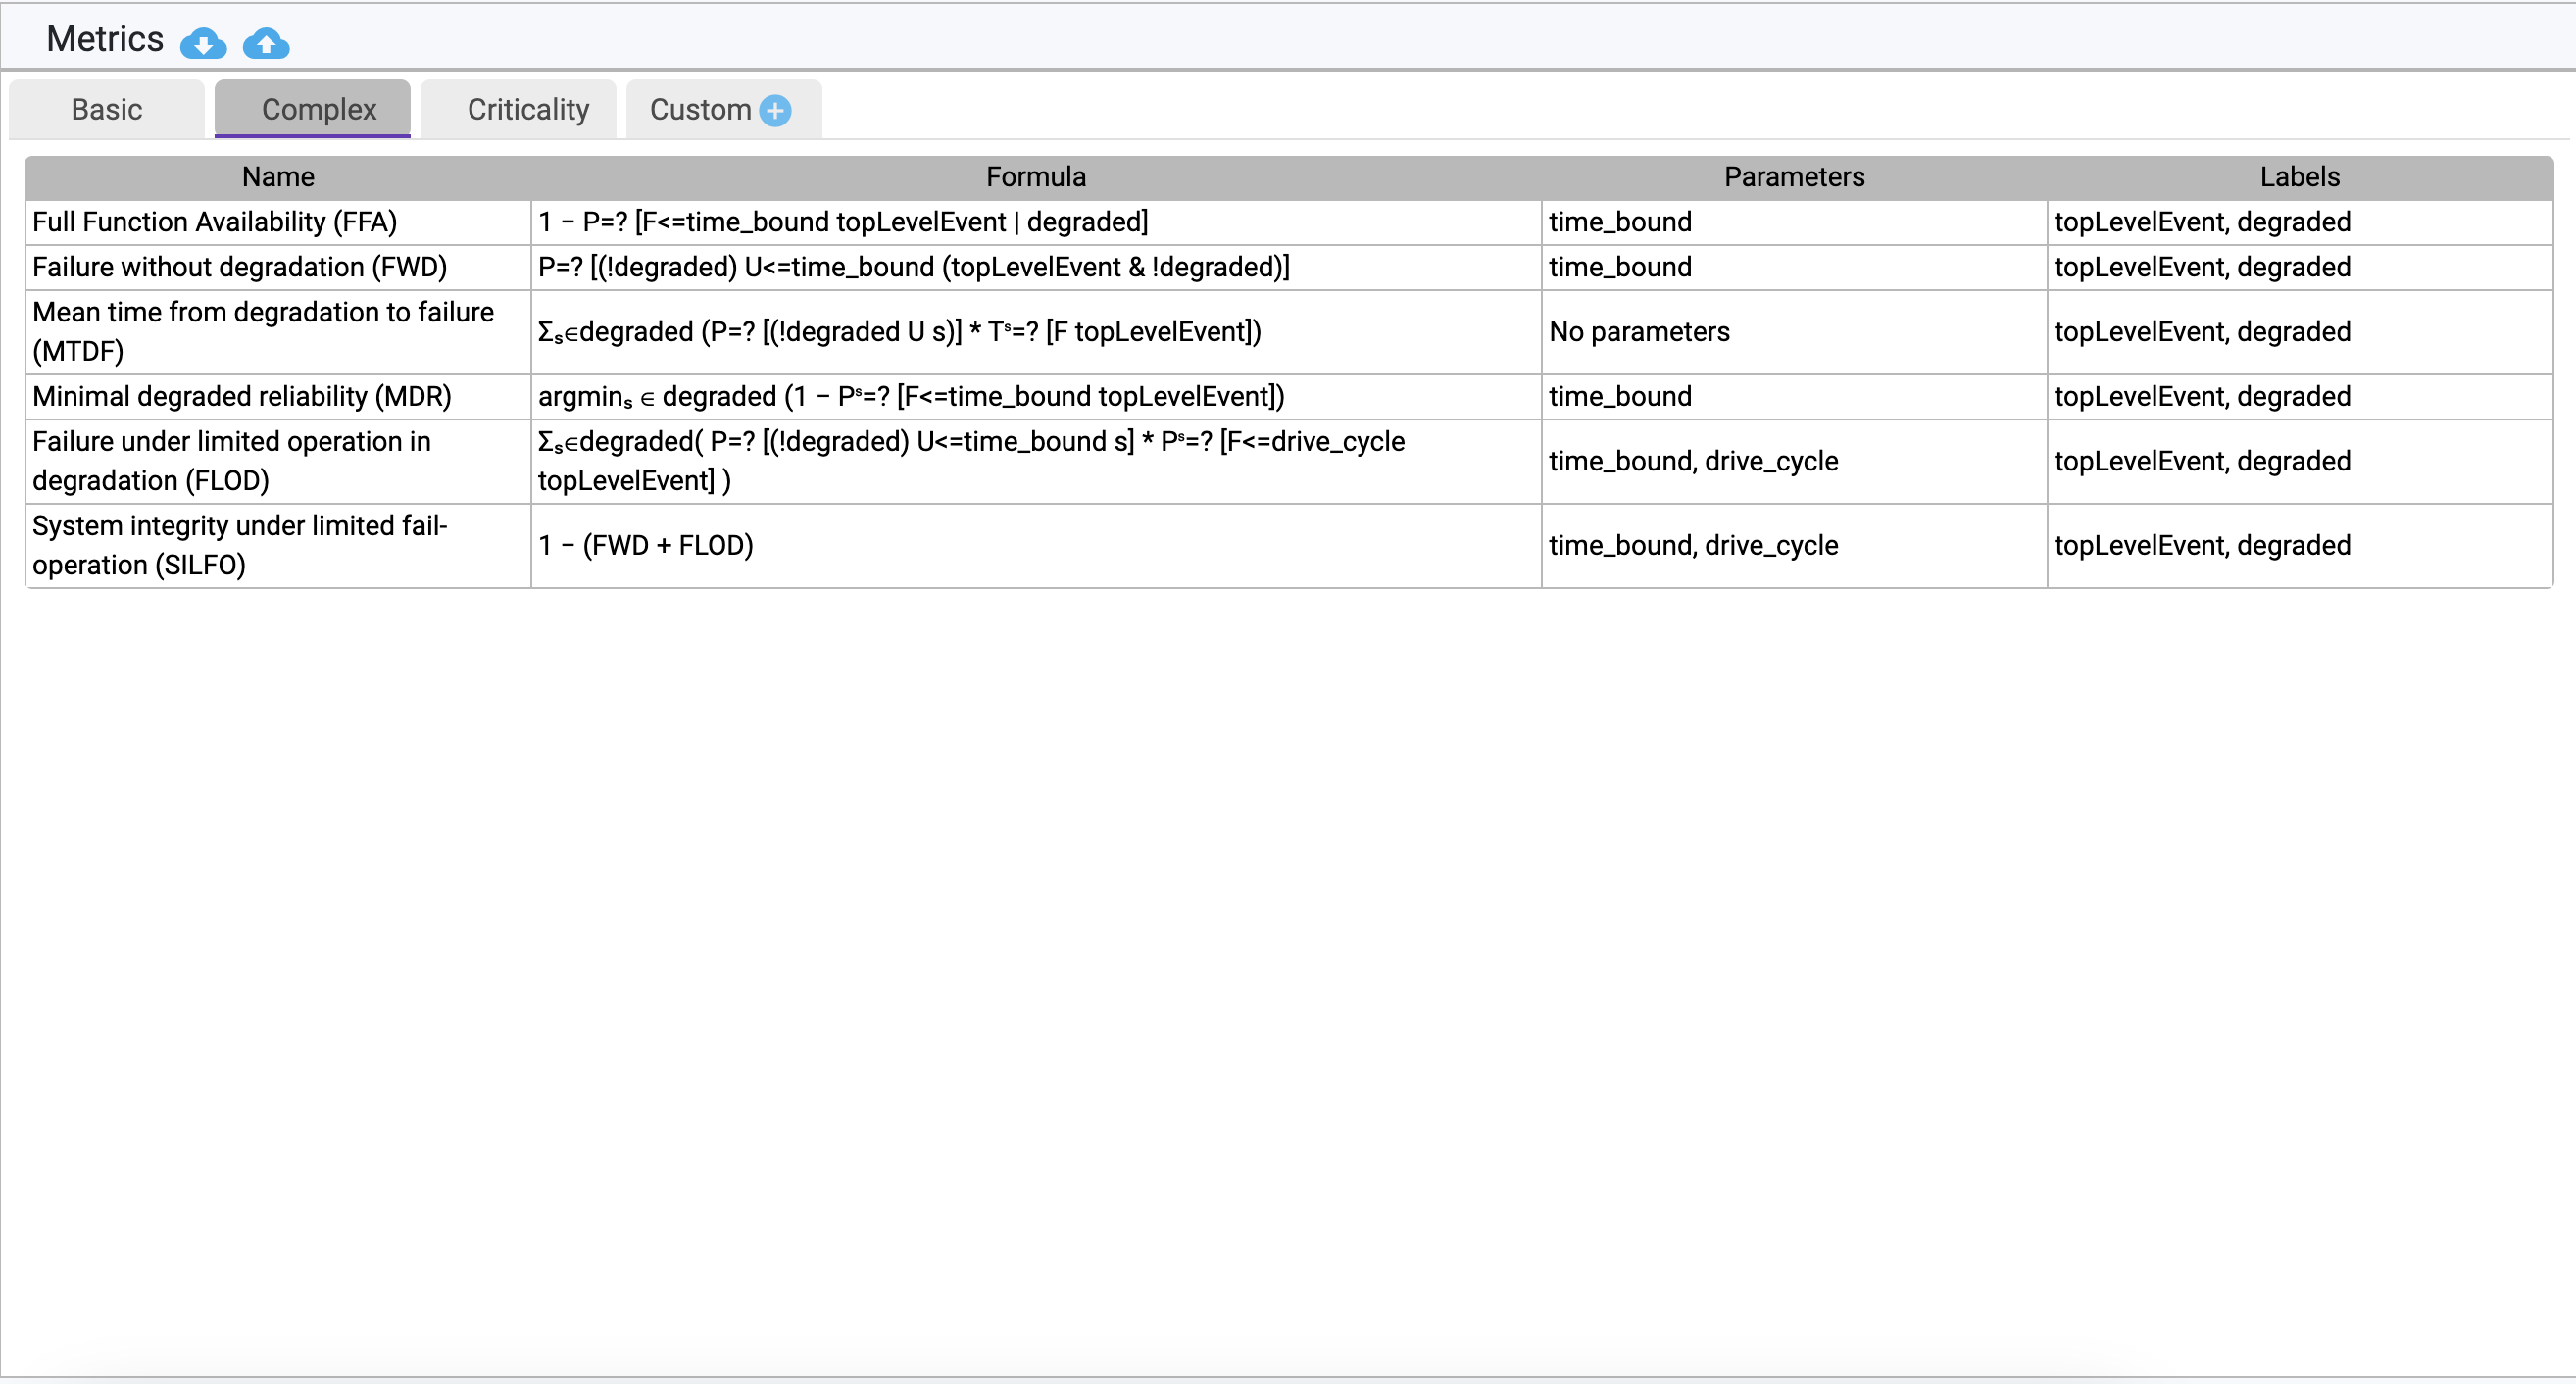
Specification of complex measures:
Fault trees are composed of basic events and intermediate gates representing different events that may occur leading to the failure of the top-level event. We allow grouping events together using boolean operators, and assigning them unique labels. Using these labels, complex measures can be defined for systems using probabilistic computational tree logic (PCTL)/continuous stochastic logic (CSL).
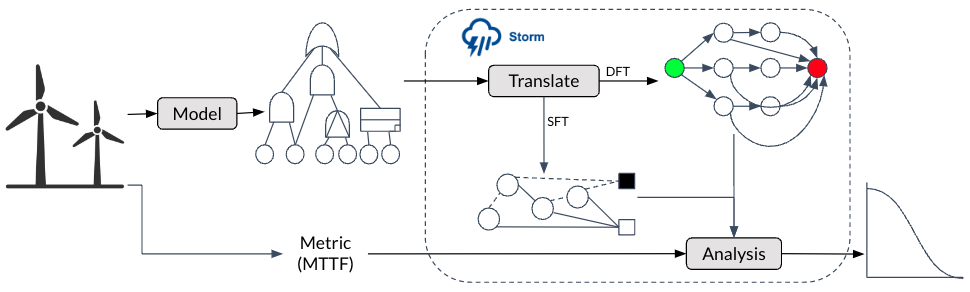
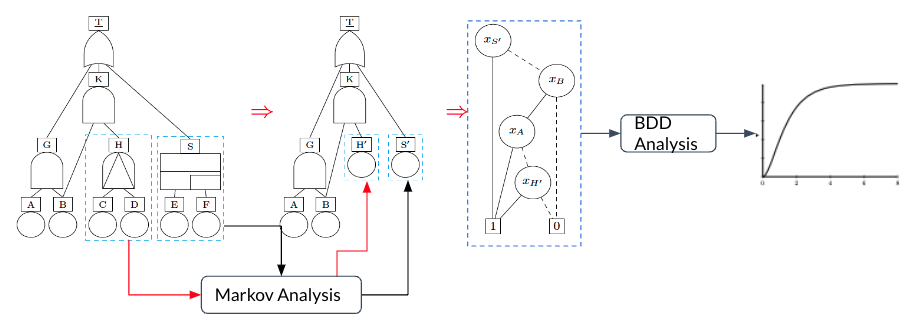
BDD, Markov and hybrid analysis
Fault trees are a key model in reliability analysis. Classical static fault trees (SFT) can best be analysed using binary decision diagrams (BDD). Whereas state-based techniques are favorable for the more expressive dynamic fault trees (DFT). We combine the best of both worlds by following Dugan’s approach: dynamic sub-trees are analysed via model checking Markov models and replaced by basic events capturing the obtained failure probabilities. The resulting SFT is then analysed via BDDs. Our implementation of Dugan’s approach significantly outperforms pure Markovian analysis of DFTs.
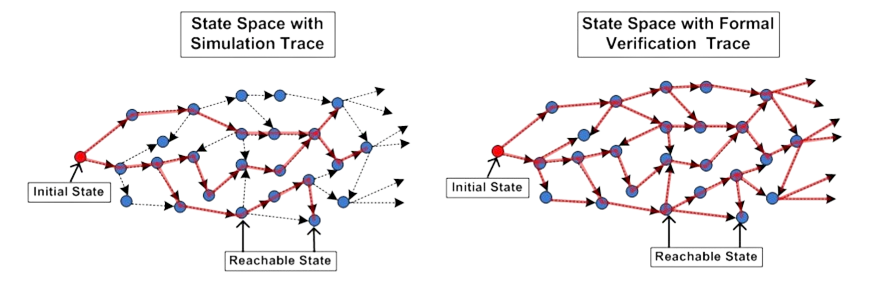
Exact analysis
Complex systems usually have dynamic behaviour because of e.g. spare components, failure sequence among components, functional dependencies, etc. The analysis of such systems is usually quite complex which is usually based on simulation or generalization techniques. Unlike others we implement formal verification techniques e.g. probabilistic model-checking, and thus provide exact results on measures of interest. For systems having large state space, we provide an iterative analysis approach providing upper and lower bounds on the exact values of measures as discussed below.
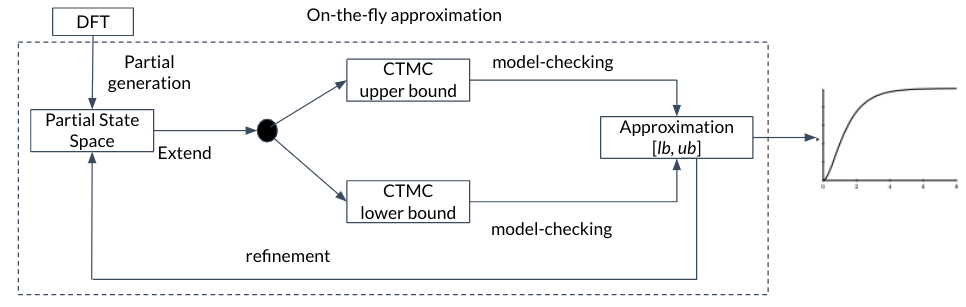
Iterative state-space generation for sound bounded analysis
In order to compute exact results for measures, first the full state space is constructed, and then analyzed. However, many states in the state space only marginally contribute to the result. If one is interested in an approximation of the MTTF (or the reliability), these states are of minor interest. We implemented the algorithms, proposed by Dr. Matthias Volk et. al., that generate state-space on-the-fly, and then compute an upper and a lower bound to the exact results on a partially unfolded system, which might be much smaller as compared to the fully unfolded system. The approximation is sound ensuring the exact result lies between these two bounds.
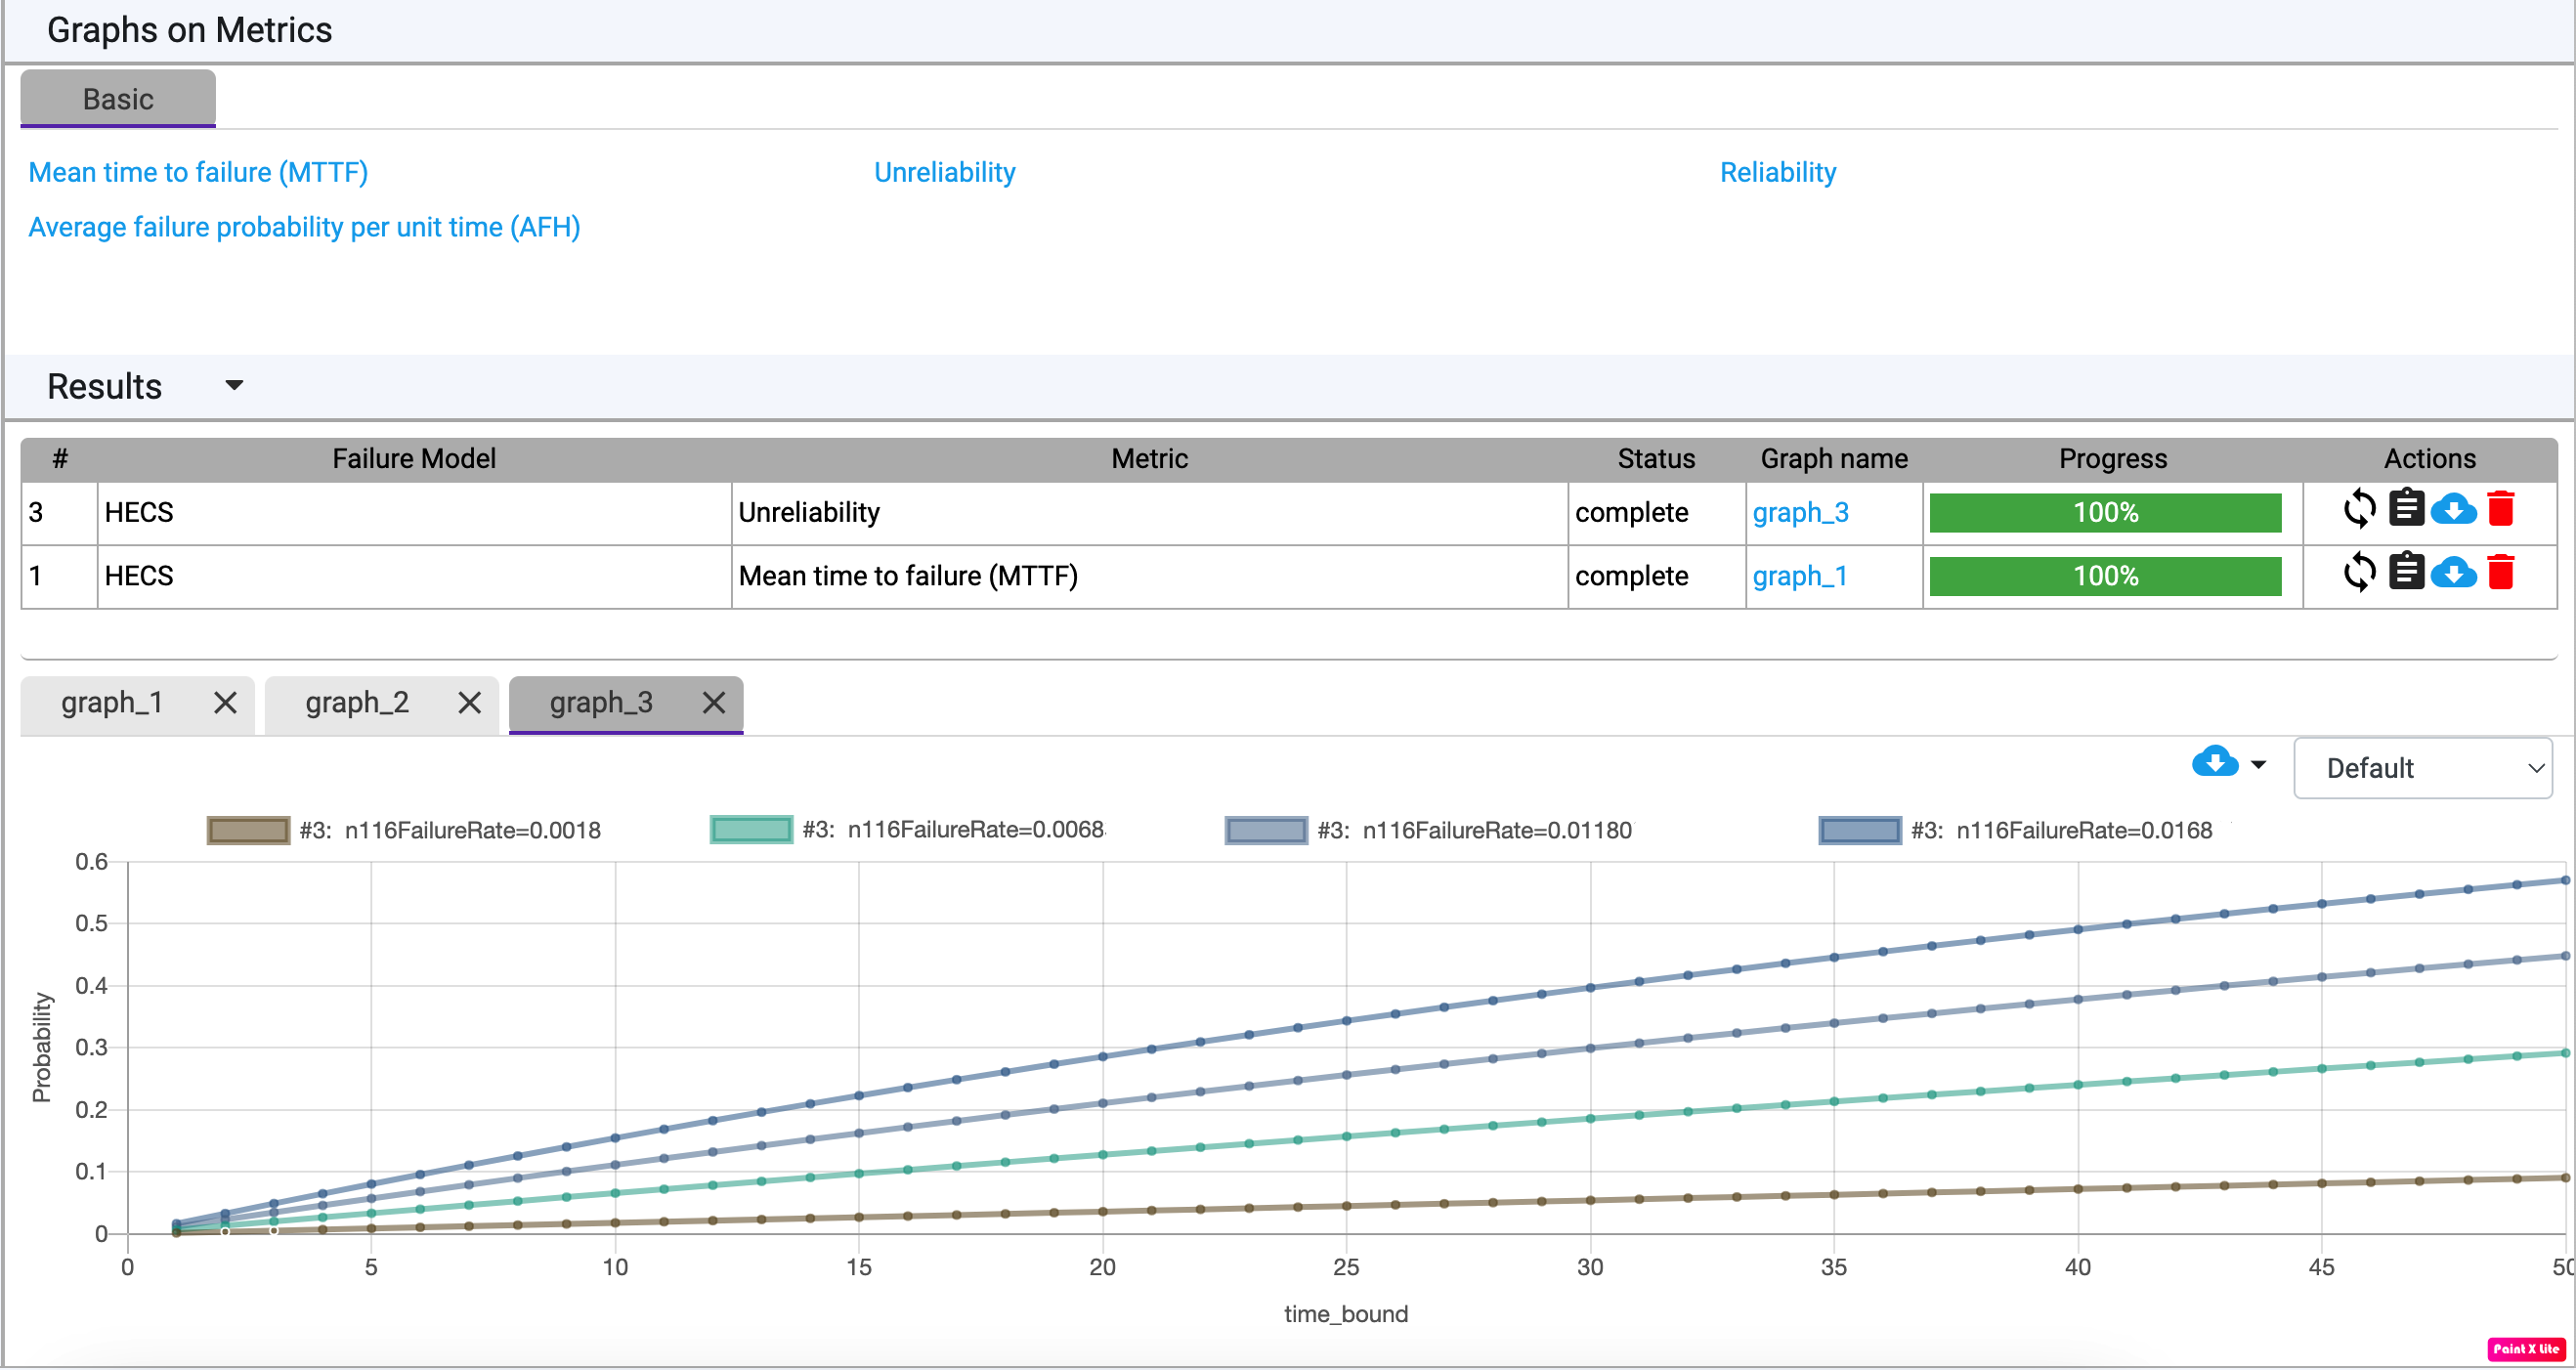
Graphs
Reliability measures help figuring out optimal maintenance schedules of systems thus reducing their downtimes and saving cost at the same time. Fault trees that model sub-systems of systems can even predict their health individually thus helping make even more detailed maintenance schedules. We provide a graphical interface to plot and compare measures of interest e.g. reliability of different sub-systems, which is helpful in deciding maintenance schedules.
Iterative simulation
The idea is to interactively visualize a sequence of failures in a DFT. The user would start with a usual DFT and could select one of the basic events (BE) that should fail first. Based on this, the status of each DFT element (failed, operational, fail-safe, claiming in SPAREs, etc.) is redetermined and then visualized. Afterwards, another BE can be selected to fail and so forth. The main benefit of this feature is that the idea of DFTs should become much clearer as users can try out the behaviour by themselves.
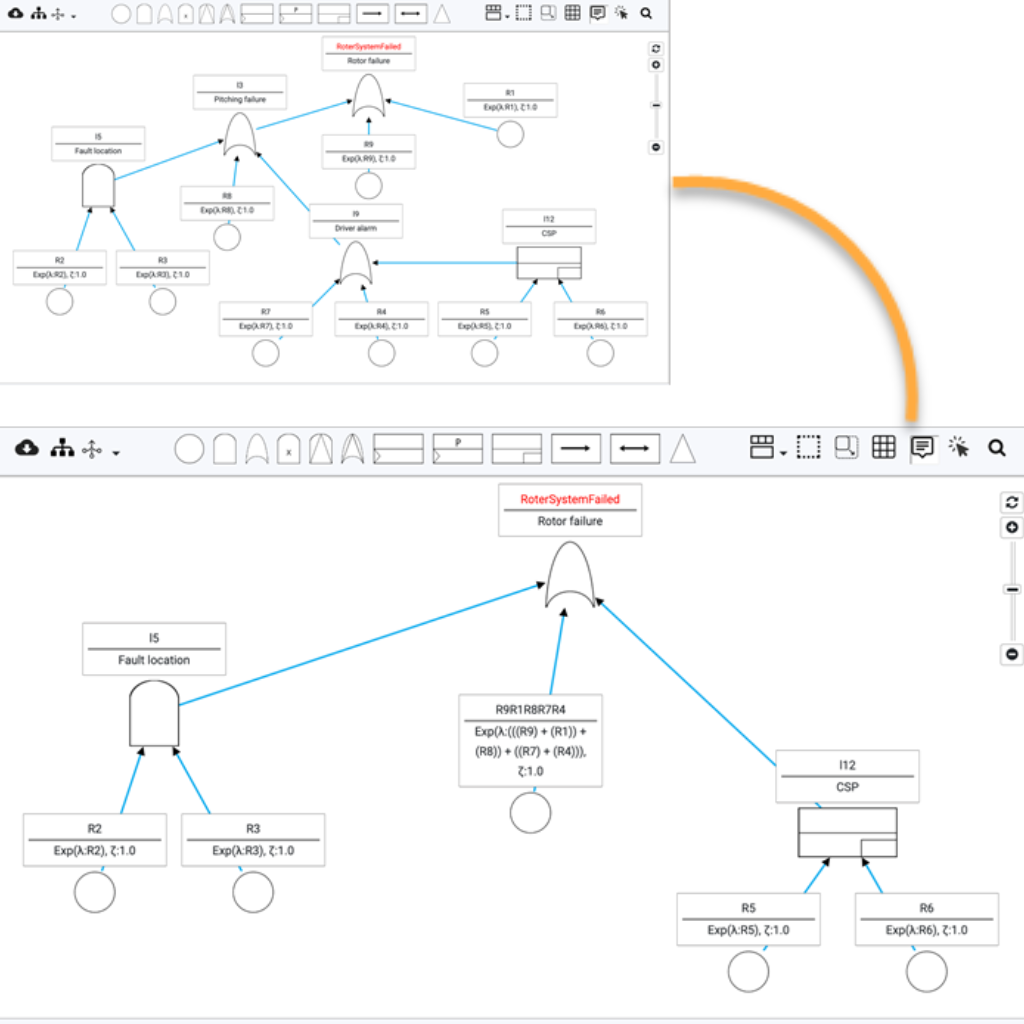
Simplification of large fault trees
Fault trees are a popular industrial technique for reliability modelling and analysis. Their extension with common reliability patterns, such as spare management, functional dependencies, and sequencing — known as dynamic fault trees (DFTs) — has an adverse effect on scalability, prohibiting the analysis of complex, industrial cases by, e.g., probabilistic model checkers. We implemented reduction techniques for DFTs by Sebastian Junges et. al. Experiments on a large set of benchmarks show substantial fault tree simplifications, yielding state space reductions and timing gains of up to two orders of magnitude.
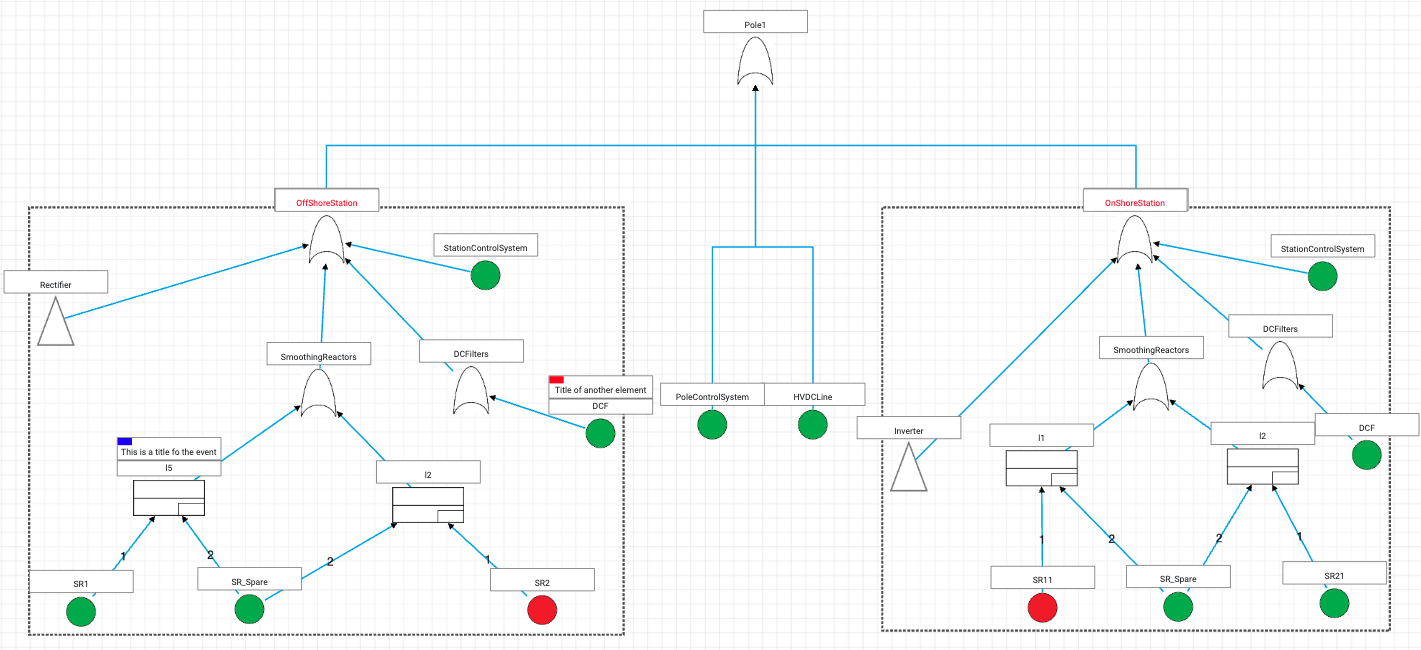
Modularization
It allows evaluating subsystems individually and simplifying the large systems into smaller ones. It helps analysing large fault trees in an iterative way. Moreover, the rendering of large fault trees on canvas sometimes does not give a true picture/understanding of the underlying fault model. We, therefore, allow interactive breakdown of large fault trees into independent modules, static or dynamic, organized in a hierarchical manner. This improves the readability of the model and allows verification of metices on individual models easily.
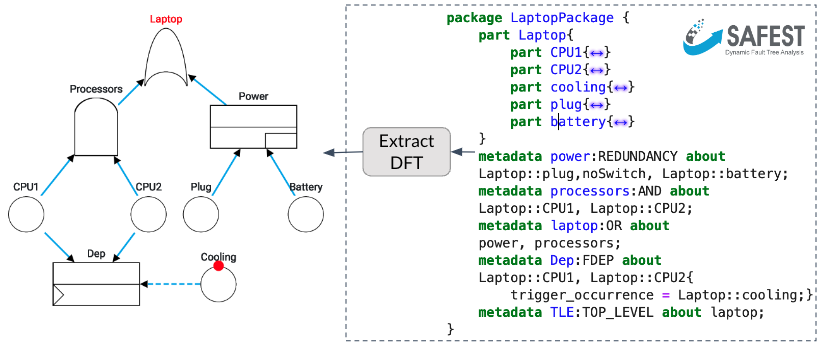
SysML-DFT Translation
SAFEST automates model-based risk assessment (MBRA) in parallel with model-based systems engineering (MBSE). By annotating safety aspects (e.g. redundancy, functional dependencies, failure ordering, etc.) in SysML 2.0 models, aur algorithm automatically extract relevant DFTs out of them. This reduces a lot of effort required in building DFTS manually from SysML 2.0 models.
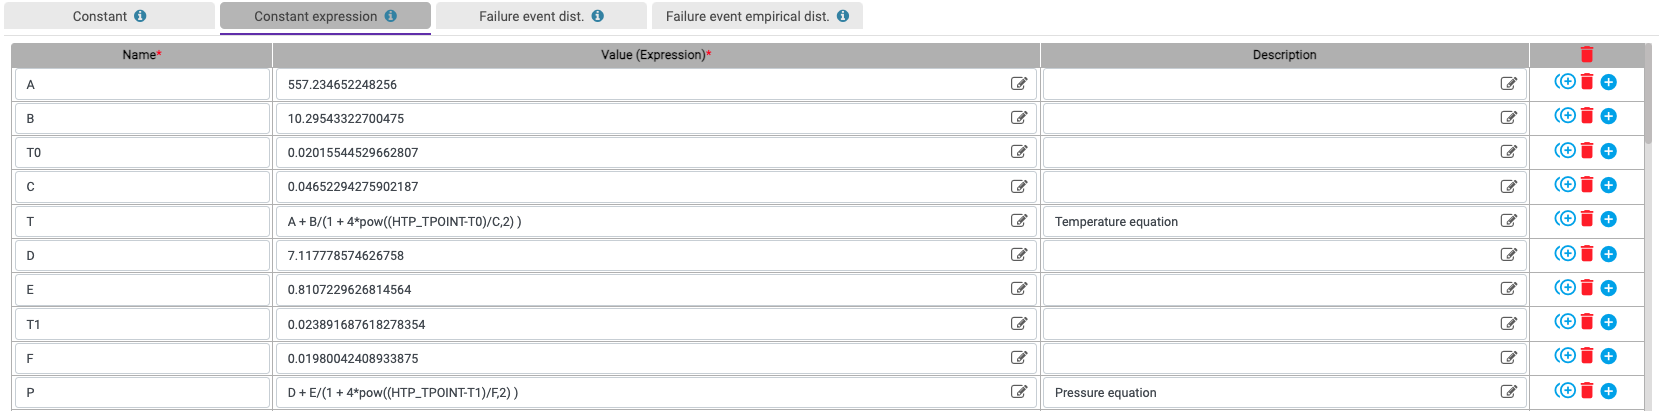
Model parameters & (empirical) failure distributions
Modal parameters can be provided in the form of constants, real expressions and failure distributions. Failure distributions can either be entered manually or evaluated from data sets generated during system operations. Furthermore, weighted failure distributions are also supported allowing combining two or more failure distributions into one failure distributions. For example, combining failure distributions from international reliability standards with empirical distributions (calculated from field data) allows having more meaningful distributions for system analysis in production.
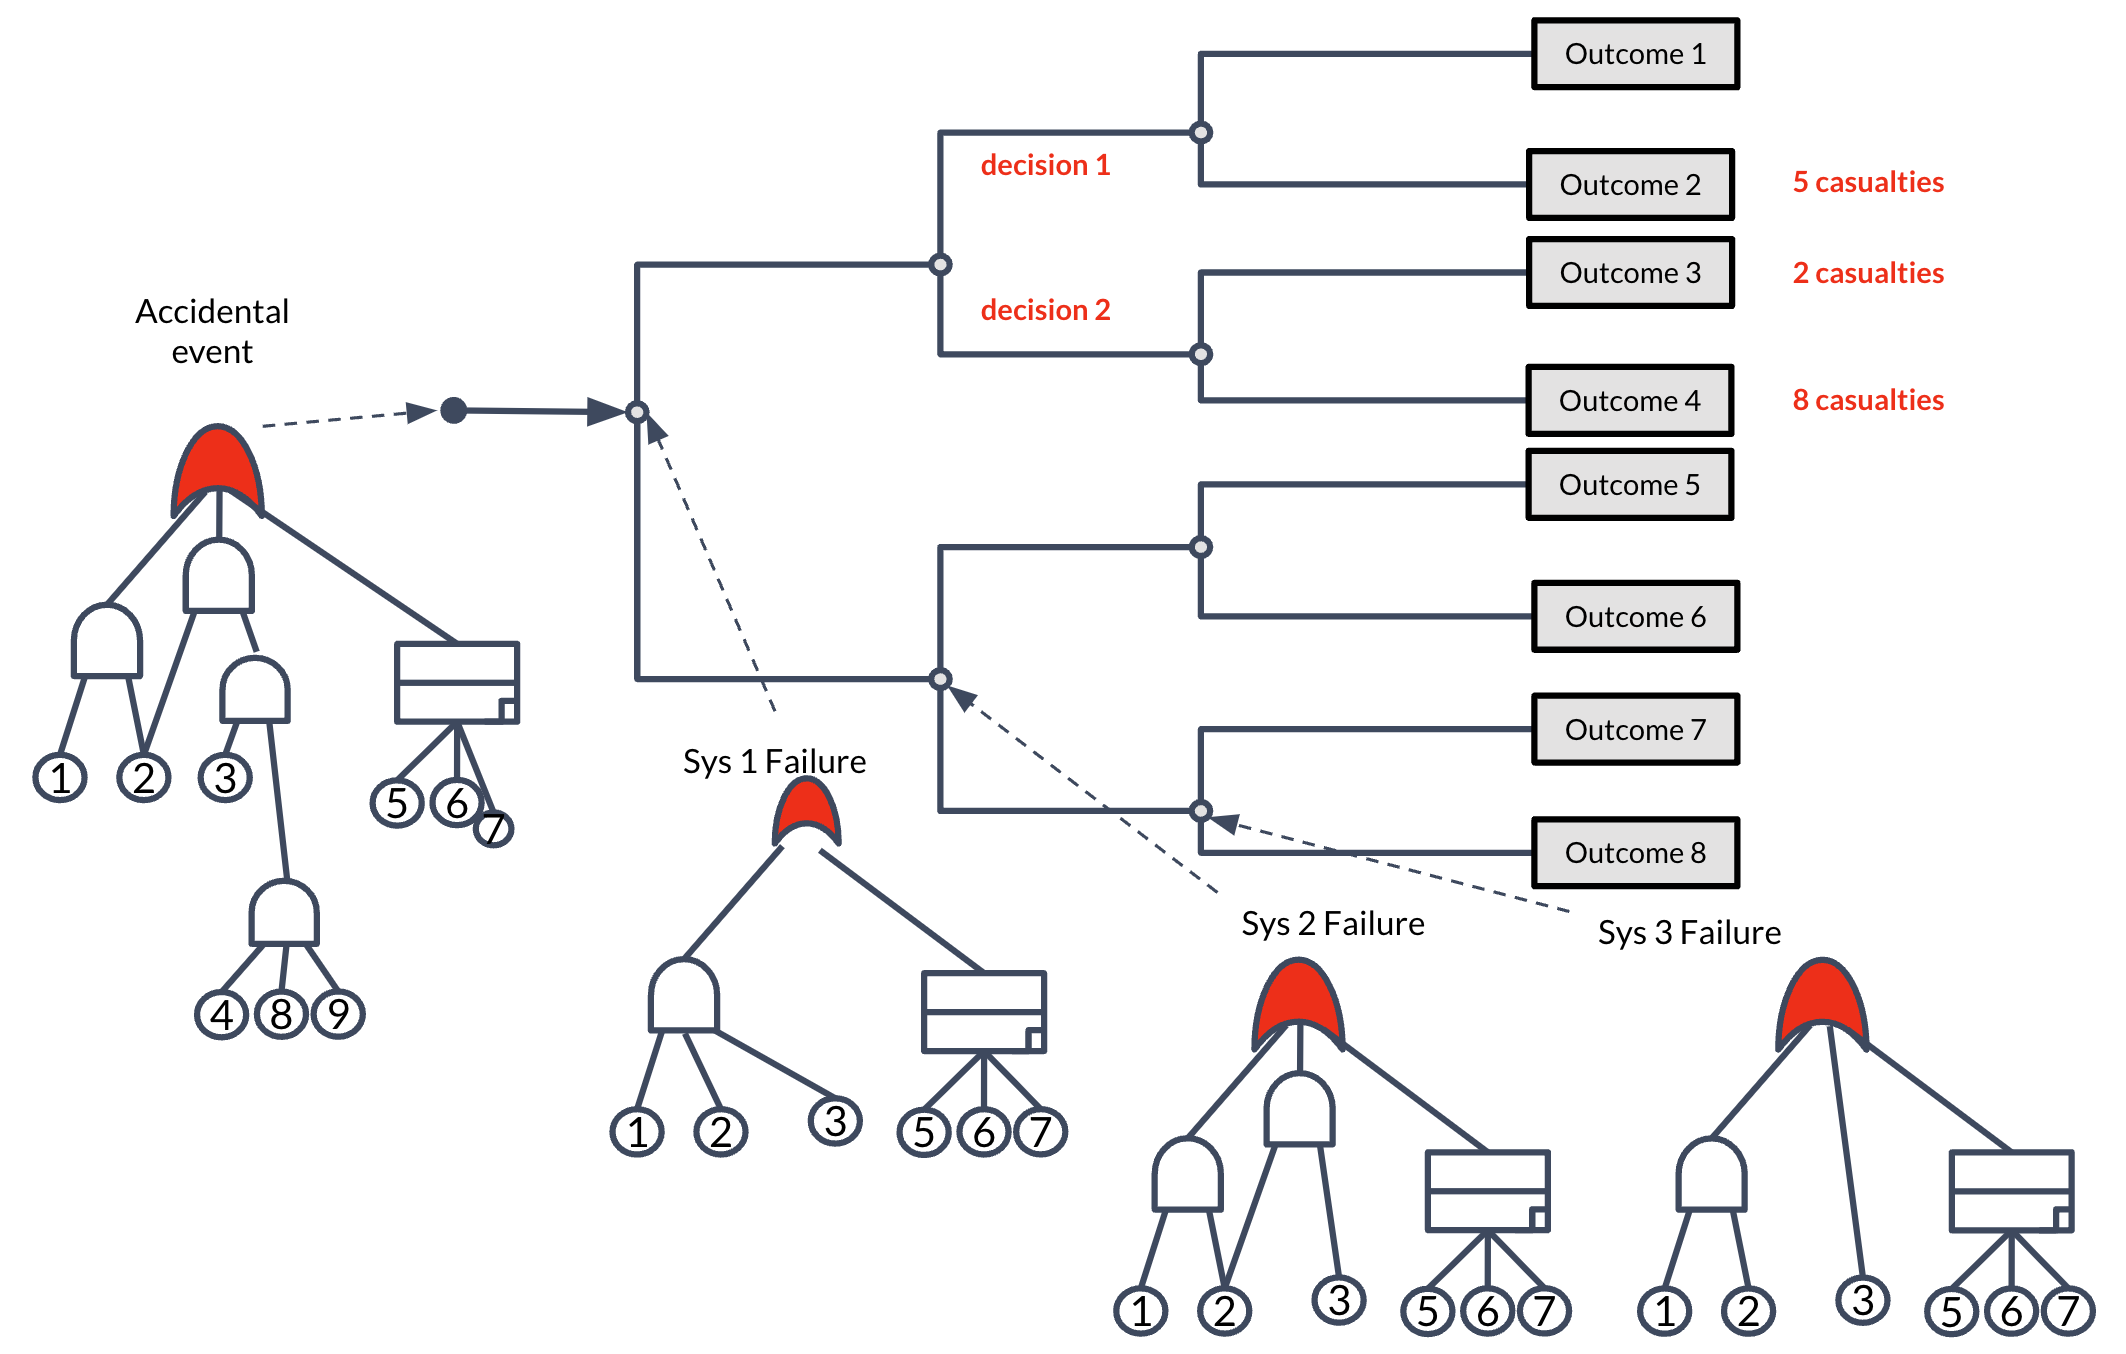
Reward event trees embedded with dynamic fault trees
We extend classical event trees with non-deterministic choices/decision-making at states and allow the addition of state rewards/losses. Moreover, DFTs can be embedded into RETs and provide transition probabilities (of RETs). By analyzing RETs, one can determine 1) expected gains or losses, such as radioactive leakage, fatalities, etc., 2) limits on the frequencies and probability of the outcomes in event trees, and 3) wise choices to, for example, lessen the unfavorable effects/outcomes.